Storm Station
Sign in

At a river or reservoir gauge

DCP network, identified by the register

Identifier
03349510
Latitude
40.17448 N
Longitude
86.00052 W
Elevation
813 ft
Observed
10:30 PMEDT, 1 hour ago
Precipitation in the gauge's latest reading
0in

Ranking Statistics

At a river or reservoir gauge

Drawn as the kind of place it stands at. 93 instruments in Indiana stand at one.

Station charts

Cicero Creek At Arcadia Report

Rank 463 of 1,111 in Indiana, Oct 16. The 247 rank orders a state's stations by their 247 score out of 100: how reliably they report, how accurate their readings are against a reference station, how their readings pass their checks, and how they stand against the forecast.

Ranking Statistics

247 score97.0of 100

Indiana median
95.8the median score of 1,111 stations
Scoring higher
462stations in Indiana
Sharing its score
30ranks 463 to 492
Points deducted
3.02.6 arrival, 0.4 forecast check
Counted at the median
Accuracy, instrument checks, forecast checknot measured at this station; Indiana median 100.0, 100.0, 96.1
Next above
MZZrank 462; ahead on 247 score 97.1 against 97.0
Next below
AMTI3rank 485; behind on reports received 100% against 99.4%
Sharing its rank
21other stations, equal on every measure

Equal scores are ordered by the share of scheduled reports received, then the reports due in the week (the longer record first), then the median arrival, then the longest silence.

  1. Reports receivedweight 35100.035.0 of 35 pointsIndiana median 99.4168 of 168 scheduled reports received in 7 days
  2. Arrivalweight 1074.47.4 of 10 pointsIndiana median 95.3half its reports arrived within 23 min
  3. Continuityweight 10100.010.0 of 10 pointsIndiana median 100.0longest silence 60 min, on a schedule of one report every 60 min
  4. Accuracyweight 20-20.0 of 20 points, at the medianIndiana median 100.0-
  5. Instrument checksweight 15-15.0 of 15 points, at the medianIndiana median 100.0-
  6. Forecast checkweight 10-9.6 of 10 points, at the medianIndiana median 96.1-

The score is the weighted mean of its six parts, from the last 7 days. How a station is ranked sets out each part.

How each part is scored
Reports received
Full marks for every scheduled report received, none for none, in proportion between
Arrival
Full marks for a median arrival within 10 min, none at 60 min
Continuity
Full marks for a longest silence of 3 reports or less (3 h), none for 72 (72 h)
Accuracy
Full marks within 1.5 °F of its reference, typically, none beyond 8.0 °F
Instrument checks
Full marks for no reading failed, none for 5 per cent or more
Forecast check
Full marks within 2 °F of the forecast on average, none at 8 °F
Schedule
every houron the hour's :30
Reports received, 24 hours
24 of 24100% of its schedule
Reports received, 7 days
168 of 168100% of its schedule
Days reported, 30 days
-
Longest silence, 7 days
74 minfrom Oct 16, 2:30 AM
Latest report
Oct 16, 2:30 AMlocal time
Time to reach Storm Station
23 min9 in 10 within 23 min

From Storm Station's own record of every report it heard from this station.

Its schedule is one report every hour, 24 in 24 hours. Two reports in the same hour count as one received.

Chart of the 1,111 ranked stations in Indiana on Oct 16 by the share of their scheduled reports received in Storm Station's own record, up to 7 days, in tenths: 0 to 9 per cent, 2; 10 to 19 per cent, 3; 20 to 29 per cent, 14; 30 to 39 per cent, 2; 40 to 49 per cent, 52; 50 to 59 per cent, 106; 60 to 69 per cent, 21; 70 to 79 per cent, 75; 80 to 89 per cent, 137; 90 to 99 per cent, 221; 100 per cent, 478. Cicero Creek At Arcadia received 100.0 per cent, 168 of 168 scheduled reports, rank 463 of 1,111.WHERE IT RANKS IN INDIANA, Oct 16THIS ONE: 100.0%, 168 OF 168, RANK 463 OF 1,111PER CENT OF SCHEDULED REPORTS RECEIVEDIN STORM STATION'S OWN RECORD, UP TO 7 DAYS1101000 to 9210 to 19320 to 291430 to 39240 to 495250 to 5910660 to 692170 to 797580 to 8913790 to 99221100478STATIONS, LOG SCALE
Chart of Cicero Creek At Arcadia's rank in Indiana by how it reported, day by day, from 2026-10-07 to 2026-10-16: 2026-10-07 rank 1,039 of 1,119; 2026-10-08 rank 1,018 of 1,110; 2026-10-09 rank 860 of 1,073; 2026-10-10 rank 862 of 1,076; 2026-10-11 rank 787 of 1,077; 2026-10-12 rank 648 of 1,084; 2026-10-13 rank 429 of 1,089; 2026-10-14 rank 409 of 1,088; 2026-10-15 rank 441 of 1,103; 2026-10-16 rank 463 of 1,111.ITS RANK IN INDIANA, DAY BY DAYRANK, FIRST AT THE TOP15001,0001,500Oct 7Oct 9Oct 11Oct 13Oct 15Oct 16
The ranking these charts were drawn from, as tables
Share of scheduled reports receivedStations
100%478
90 to 99%221
80 to 89%137
70 to 79%75
60 to 69%21
50 to 59%106
40 to 49%52
30 to 39%2
20 to 29%14
10 to 19%3
0 to 9%2
DayRankStations rankedShare received
Oct 16, 20264631,111100.0%
Oct 15, 20264411,103100.0%
Oct 14, 20264091,088100.0%
Oct 13, 20264291,089100.0%
Oct 12, 20266481,08486.3%
Oct 11, 20267871,07772.0%
Oct 10, 20268621,07657.7%
Oct 9, 20268601,07357.1%
Oct 8, 20261,0181,11029.1%
Oct 7, 20261,0391,11914.8%

Station report

Cicero Creek At Arcadia, in 3 sheets

Drawn from the register, in the manner of the Field Book, and opened beside the plates that explain each part of it.

1The column

Contents

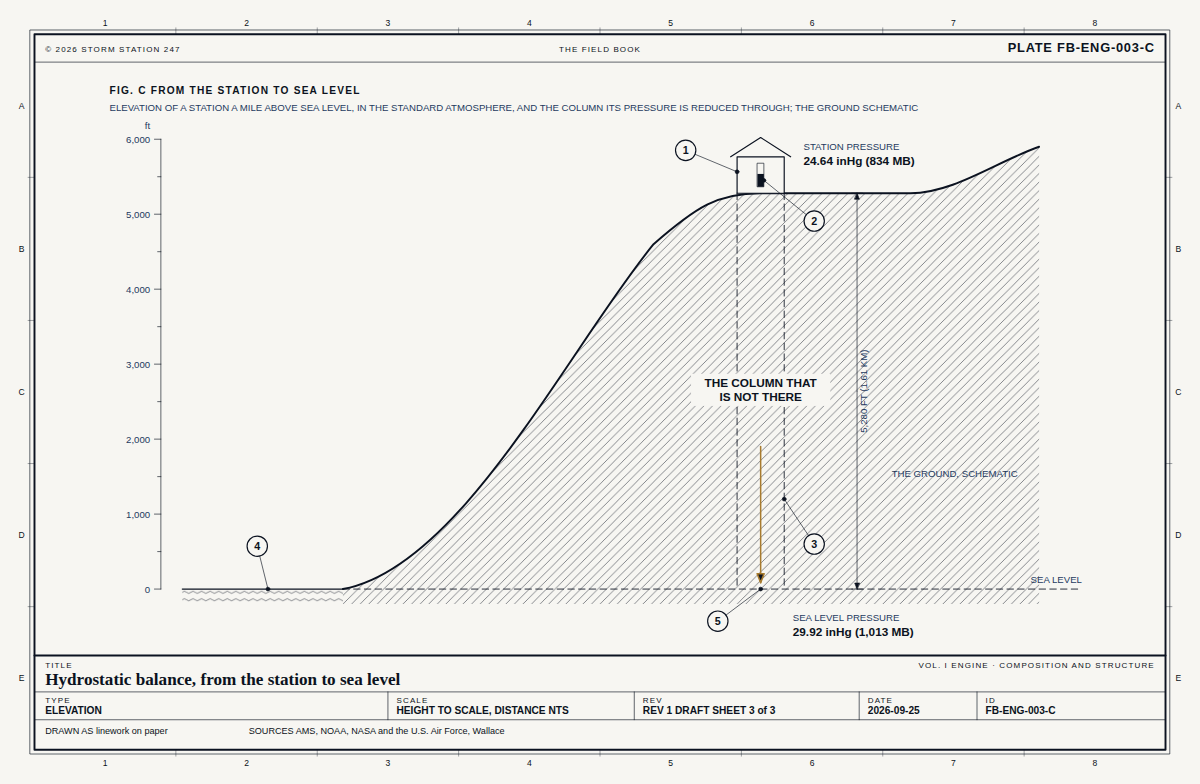
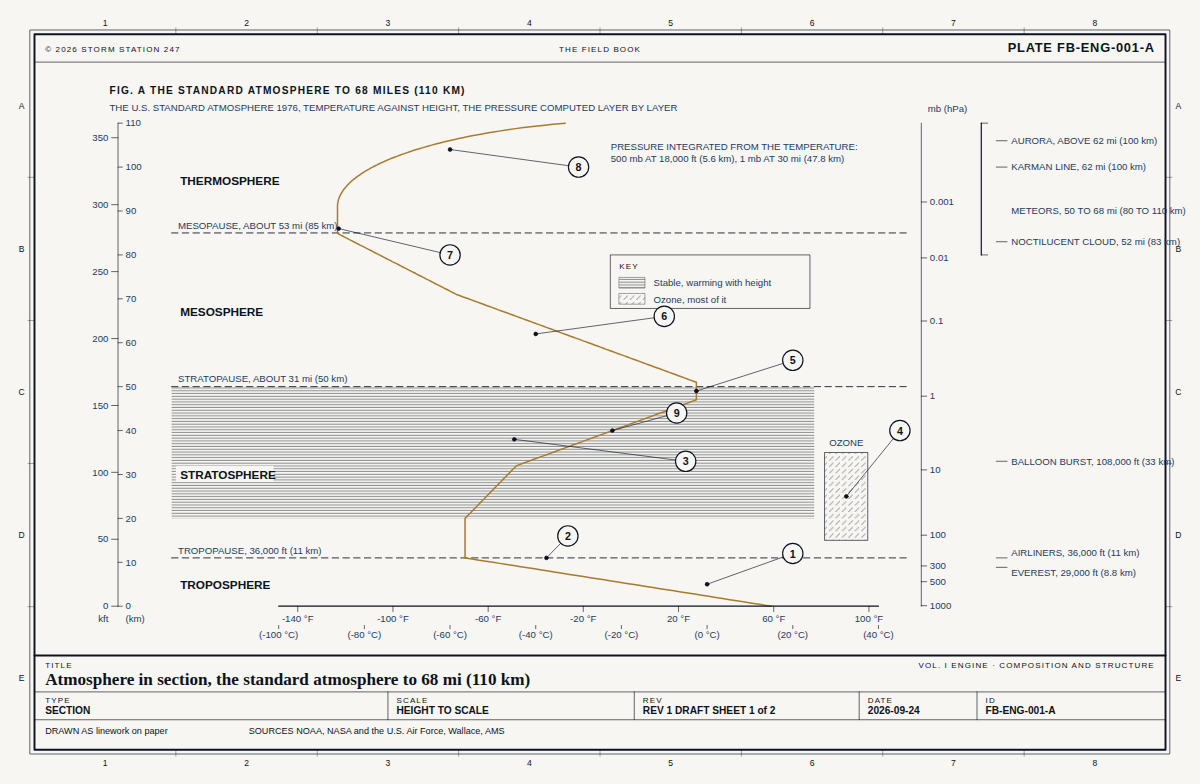
At 813 ft above sea level, 3 per cent of the atmosphere's air lies below the station. The standard atmosphere puts the pressure there at 29.05 inHg and the temperature at 56.1 F.

Section from sea level of where Cicero Creek At Arcadia stands in the atmosphere, height to scale: the station 813 feet above sea level with 3 per cent of the air below it; the standard atmosphere's pressure there, 29.05 inches of mercury, and temperature, 56.1 degrees Fahrenheit.1122334455667788AABBCCDDEE© 2026 STORM STATION 247THE FIELD BOOKSTATION REPORT 03349510FIG. D WHERE CICERO CREEK AT ARCADIA STANDS IN THE ATMOSPHERESECTION FROM SEA LEVEL, HEIGHT TO SCALE, THE STATION IN THE STANDARD ATMOSPHEREFT ABOVE SEA LEVEL05,00010,00015,000SEA LEVEL, 29.92 inHg IN THE STANDARD ATMOSPHERECICERO CREEK AT ARCADIA3 PER CENT OF THE AIR BELOW IT813 FT10 PER CENT OF THE AIR BELOW, 2,890 FT20 PER CENT OF THE AIR BELOW, 6,050 FT30 PER CENT OF THE AIR BELOW, 9,540 FT40 PER CENT OF THE AIR BELOW, 13,470 FTSTANDARD PRESSURE HERE29.05 inHgSTANDARD TEMPERATURE HERE56.1 FTITLECicero Creek At Arcadia, the columnSTATION REPORT · DCP 03349510TYPESECTIONSCALEHEIGHT TO SCALEREVFROM THE REGISTER SHEET 1 of 3DATE2026-10-16IDSR-03349510-1DRAWN AS linework on paperSOURCES FB-ENG-001, FB-ENG-003

From the Field Book

2The sun

Contents

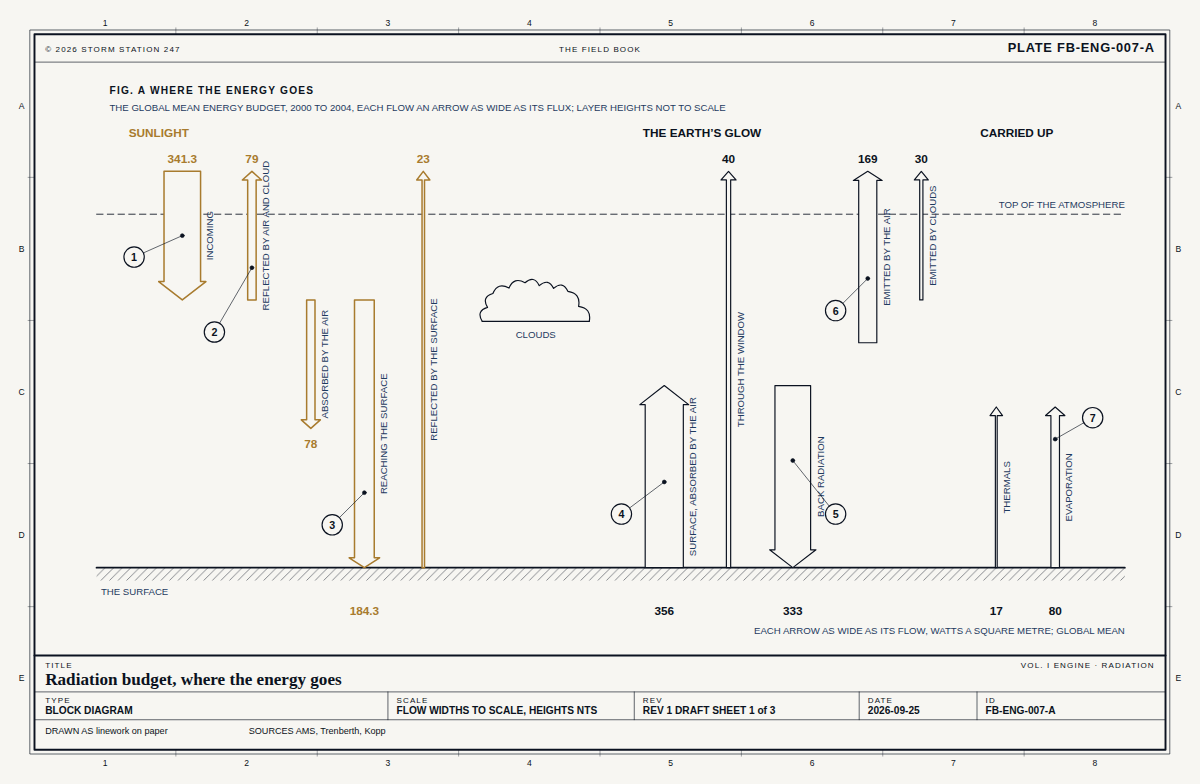
On Oct 16 the noon sun stands 41 degrees above the horizon at 40.17 N, and the day is 10 h 58 min long. Level ground there takes 65 per cent of the noon sunlight a surface facing the sun would.
Elevation of the noon sun at Cicero Creek At Arcadia, angles true: on Oct 16 it stands 41 degrees above the horizon, against 73 at the June solstice, 50 at the equinoxes and 26 at the December solstice; the day is 10 h 58 min long.1122334455667788AABBCCDDEE© 2026 STORM STATION 247THE FIELD BOOKSTATION REPORT 03349510FIG. E THE SUN AT CICERO CREEK AT ARCADIAELEVATION LOOKING WEST, SOUTH TO THE LEFT: THE NOON SUN ON THE DAY OF THE REPORT, AND AT THE SOLSTICES AND EQUINOXES; ANGLES TRUETHE STATIONJUNE SOLSTICE 73°EQUINOXES 50°DECEMBER SOLSTICE 26°OCT 16, 41°SOUTHANGLES TRUE; THE RAYS ARE OF ONE LENGTH AND DRAW DIRECTION ONLYDAY LENGTH 10 H 58 MINLEVEL GROUND TAKES 65 PER CENT OF THE NOON SUN A FACING SURFACE WOULDLATITUDE 40.17 N; THE SUN'S DECLINATION -9.1°TITLECicero Creek At Arcadia, the sunSTATION REPORT · DCP 03349510TYPEELEVATIONSCALEANGLES TRUEREVFROM THE REGISTER SHEET 2 of 3DATE2026-10-16IDSR-03349510-2DRAWN AS linework on paperSOURCES FB-ENG-007

From the Field Book

3The instrument

Contents

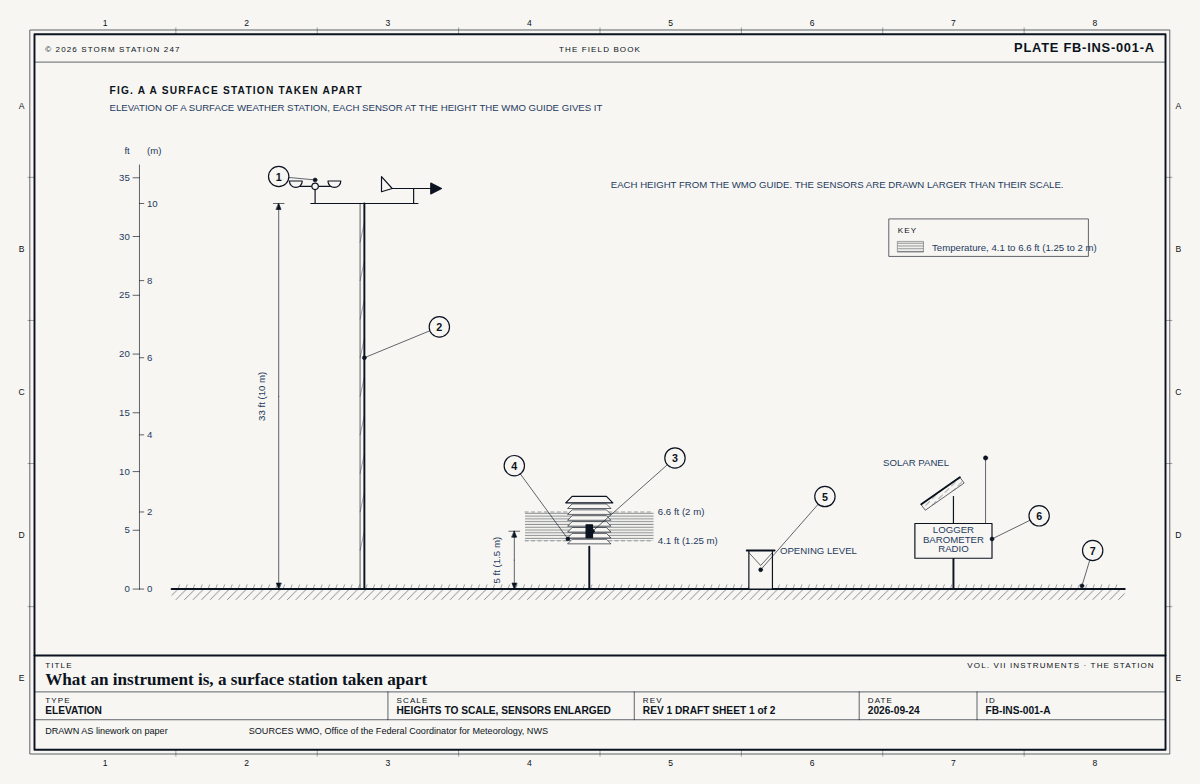
A data collection platform, 813 ft above sea level. Its sensors, as its network builds them.

Elevation of a data collection platform, Cicero Creek At Arcadia, each sensor drawn and labelled with what it read: no reading in the last day.1122334455667788AABBCCDDEE© 2026 STORM STATION 247THE FIELD BOOKSTATION REPORT 03349510FIG. F THE INSTRUMENTELEVATION OF A DATA COLLECTION PLATFORM, EACH SENSOR WITH WHAT IT READANTENNA, SENDING BY SATELLITE-AIR TEMPERATURE-PRECIPITATION GAUGE-SCHEMATIC; THE SPACING BETWEEN SENSORS IS NOT TO SCALETITLECicero Creek At Arcadia, the instrumentSTATION REPORT · DCP 03349510TYPEELEVATIONSCALESCHEMATICREVFROM THE REGISTER SHEET 3 of 3DATE2026-10-16IDSR-03349510-3DRAWN AS linework on paperSOURCES FB-INS-001

From the Field Book

Near Cicero Creek At Arcadia